
This guide introduces our innovative approach to analysis and how you can easily see the learning journey of an individual, group or class based on real-time Balance data.
Pupils’ learning journeys are benchmarked against suggested progress from our panel of industry experts, or a progress path that you can tailor to learning in your school.
Quick Steps
- Navigate to Analysis and select Learning Journey
- Use the Universal Filter to choose between classes or groups
- The chart will now display the % of secured objectives for the class against the Balance default progress trend line for the selected year
- To view the learning journey for a specific pupil within your selected class or group, click Plot Individual Pupil and select the pupil from the drop-down list
- Click Age Related Expectation to view the desired percentage of secured objectives from the current curriculum year only month-by-month.
Need More Detailed Help?
Learning Journey Explained
From the homepage, navigate to the Analysis tab. Then select Learning Journey.
Your default class will now appear. Use the Universal Filter to choose between classes or groups. Under the filter, you will find the Subject drop-down, which will allow you to filter pupils in a group using a certain subject.
The chart will now display the % of secured objectives for the class against the Balance default progress trend line for the selected year.
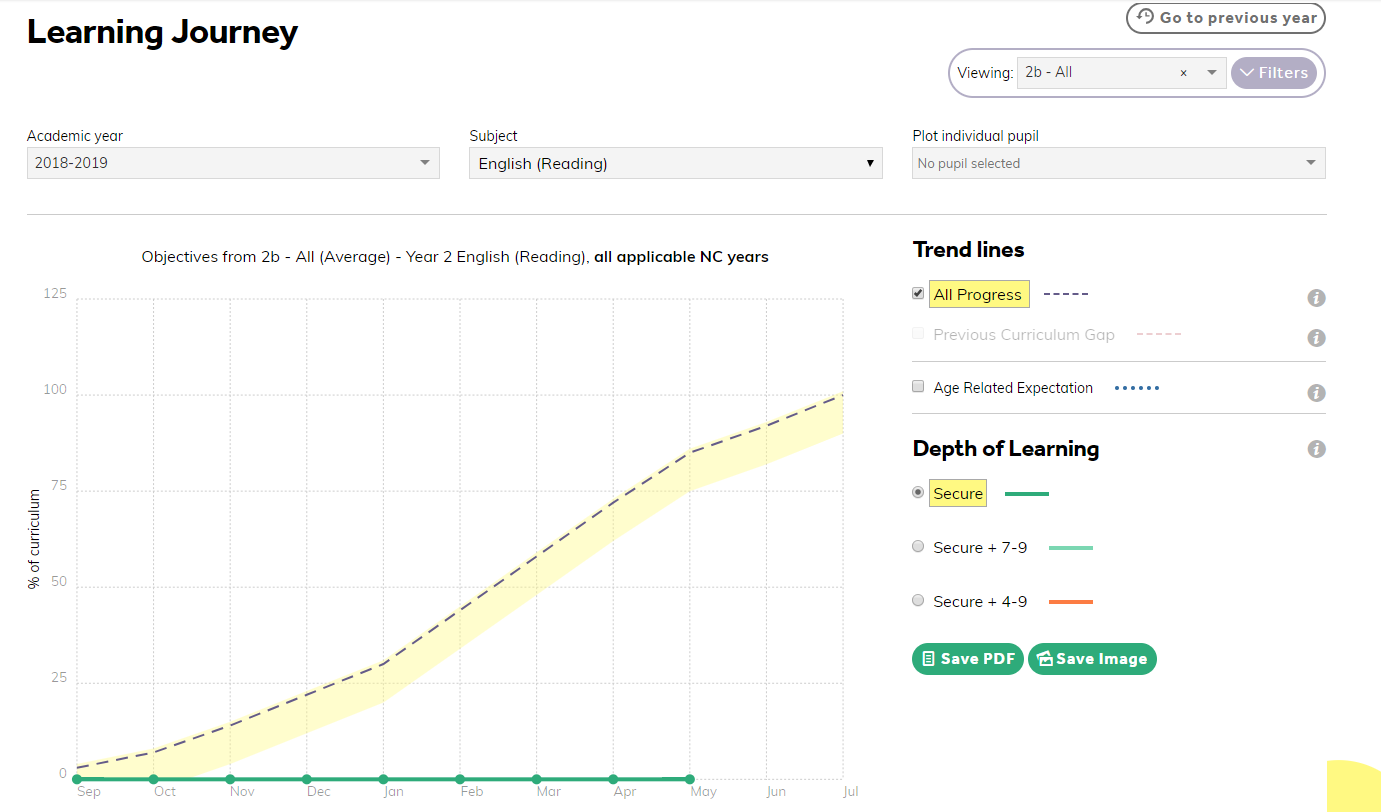
As this is a progress trend line, Balance will include objectives secured from any curriculum year, providing these have been secured during the current academic year. You can hover over any point to see the value.
The yellow band surrounding the trend line shows a confidence band for expected progress.
To view the learning journey for a specific pupil within your selected class or group, click Plot Individual Pupil and select the pupil from the drop-down list. This list will be populated with pupils from the selected group or class.
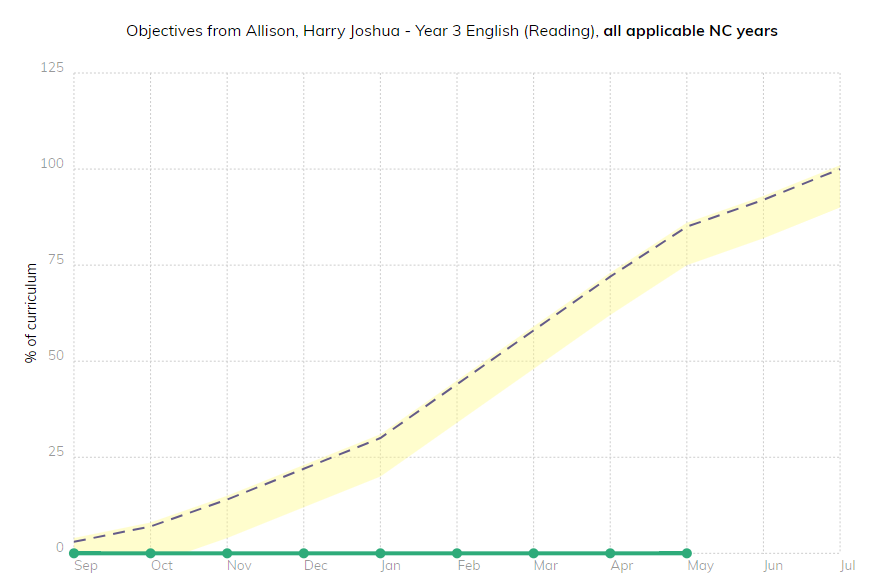
If the pupil has their own custom trend line, the chart will display the pupil’s progress against that custom line. If not, then the default progress line for the class and subject will be used.
To include objectives in the chart that have been recorded, but not yet secured, Balance provides a filter to allow you to also include objectives scored 7-9, as well as those scored 4-9.
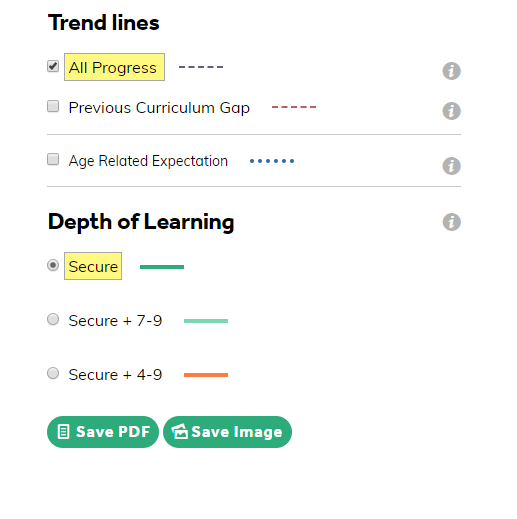
If you choose to include the Previous Curriculum Gap in the choice of trend lines, you can also see how that pupil is benchmarked against the desired percentage of objectives achievable within the given curriculum year, plus the percentage of unsecured objectives from previous years.
Age Related Expectation (ARE)
Click Age Related Expectation to view the desired percentage of secured objectives from the current curriculum year only month-by-month. A pupil that follows this line will achieve ARE by the end of the year.
The ARE trend line will closely follow the progress trend line. By default, this is set to be 90% of the curriculum.
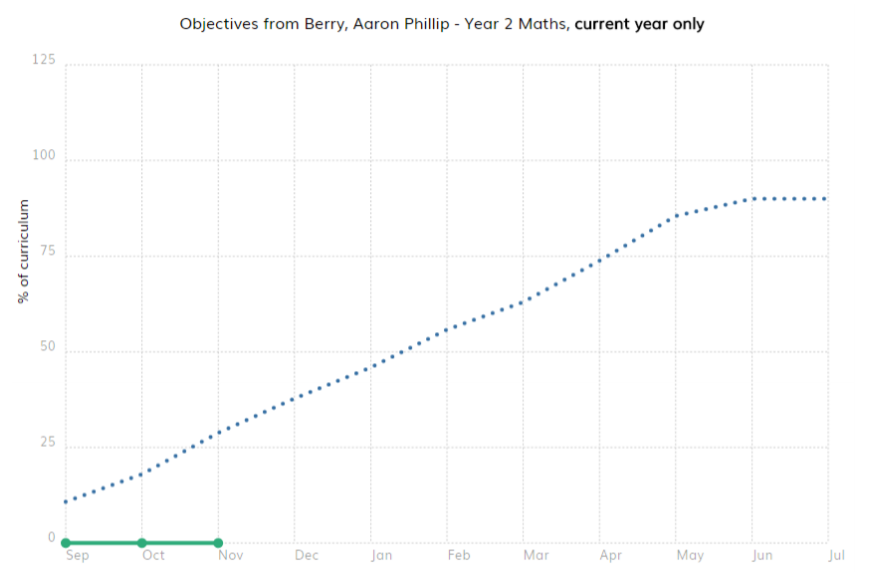
If the selected class is a mixed year group, this may skew analysis. You will be alerted if this is the case.
A user with the relevant permission will be able to edit an individual trend line for a pupil.
This appears and can be edited below the progress chart for a given pupil.
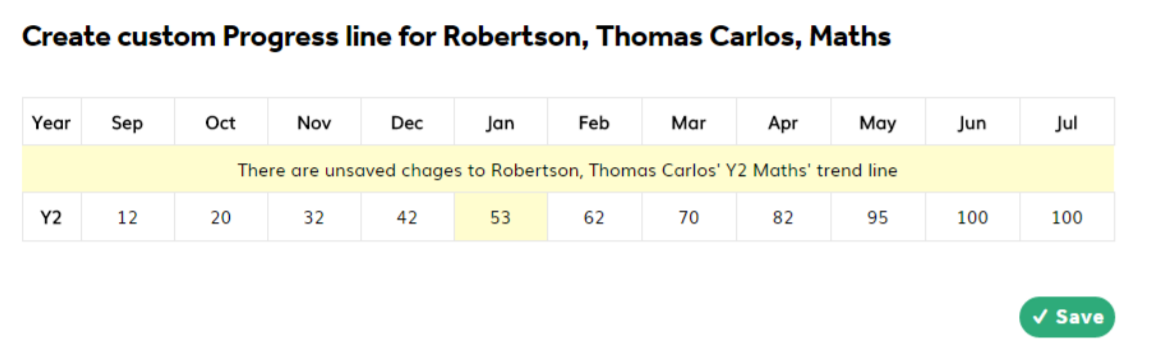
Please note: This will override the default trend line for the pupil.
To save the progress chart as a PDF or as an image, select the appropriate buttons. This is particularly useful if you need to save the image inside a separate document or wish to email or print out the chart as it appears on your screen.
Click on the information icons across the screen to access additional help on each element.