
The Learning Matrix will allow you to view a summary of the Progress made by each pupil in a class for all core subjects and identify if they are working at Age Related Expectations (ARE).
It can be accessed by going to Analysis > Learning Matrix:
It will also allow you to access the individual Trend lines of a pupil by clicking on the symbol on the far right side of a pupil's name.

This data is all pulled from the Learning Journey. Please refer to our guide on the Learning Journey
The Learning Journey is completely customisable, as a school you are able to set your own Confidence band, and Trend Lines. Please see the Trend Lines guide for more information.
Once your Trend Lines are set and your Learning Journey has data, this will feed into the Learning Matrix and provide information for the following areas:
Progress
This indicates the progress of a child at any given point. This may be in line with the teacher's long term plan and Learning Journey. This will indicate any concerns for learning or suggest whether gaps in learning are being filled/have advanced from the starting points.
Progress is shown through three indicators:
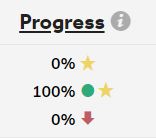
Yellow Star: Very Happy
Green Circle: Happy
Red Arrow: Concerned
ARE
A tick indicates that a child is on track to achieve ARE by the end of the year. This is based on the trend lines set for Progress across the year, the year-end value for ARE can be edited in the confidence band section.
By default in Balance, In order for a child to achieve ARE, 90% of the curriculum must be secured by the end of the year. This can also be customised and is shown in the Trend Lines guide above.
ARE Diff
Age-Related Expectation Difference. This shows the difference between the % of objectives that have been achieved from within the particular year group, against the desired ARE line.
The ARE line provides a learning journey for the child to ensure they achieve what is expected of them by the end of the year.
A high negative value indicates that the pupil will have to do more to achieve ARE by the end of the year.
GAP
These values show for the selected date period the percentage of objectives achievable within the given curriculum year, plus the percentage of unsecured objectives from previous years.
Once you are happy with your Learning Matrix, you can export the data into both a PDF or Excel sheet.
You can do this by clicking the Save PDF and Export Excel buttons.