
The Aggregate Matrix allows you to view a summary of the progress made by contextual groups and identify the proportion working at ARE. (Age-Related Expectations)

It can be accessed by navigating to Analysis > Aggregate Matrix.
To start, you can filter and select one from the Core subjects, as well as the time frame you wish to look at and the level Secured (Understanding) for all objectives.

The matrix will update automatically once a filter is selected.
The matrix provides you with a breakdown of progress over the three main areas. These are:
- Concerned
- Happy
- Very Happy
It also shows the percentage of pupils working at ARE and breaks this down further into contextual groups such as gender, SEN, PP, EAL, FSM6 and CLA.
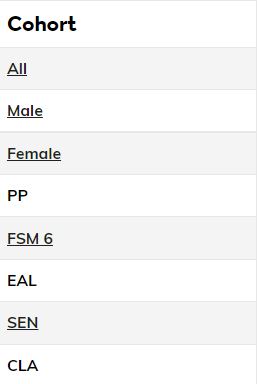
Both the Progress and ARE are calculated based on the Learning Journey. The year and value for ARE can be customised. For more information, please refer to the following guide: Trend Lines
Once your Trend Lines are set and your Learning Journey has data, this will feed into the Aggregate Matrix and provide information for the following areas:
ARE
A tick indicates that a child is on track to achieve ARE by the end of the year. This is based on the trend lines set for Progress across the year, the year-end value for ARE can be edited in the confidence band section.
By default in Balance, In order for a child to achieve ARE, 90% of the curriculum must be secured by the end of the year. This can also be customised and is shown in the Trend Lines guide above.
Progress
Concerned:
- Indicates the percentage of children for whom progress is a concern.
- This is based on the trend lines and confidence bands set for progress across the year.
Happy:
- Indicates the percentage of children for whom progress is in line with the long term plan and Learning Journey. This figure includes children whose progress may suggest gaps in learning are being filled/have advanced starting points.
- This is based on the trend lines and confidence bands set for progress across the year.
Very Happy:
- Indicates the percentage of children whose progress may suggest gaps in learning are being filled/have advanced starting points.
- This is based on the trend lines and confidence bands set for progress across the year.
Once you are happy with your Learning Matrix, you can export the data into both a PDF or Excel sheet.
You can do this by clicking the Save PDF and Export Excel buttons.